FORECAST ANALYSIS
Much has been written about developing better forecasting and budgeting templates or improving the overall process. But to my surprise there is hardly any focus on the role of analysis. I have seen many organizations where managers ‘survive’ the forecasting and budgeting cycle without ever spending time performing meaningful analysis of their data. They simply focus on getting the numbers in to satisfy finance and senior management.
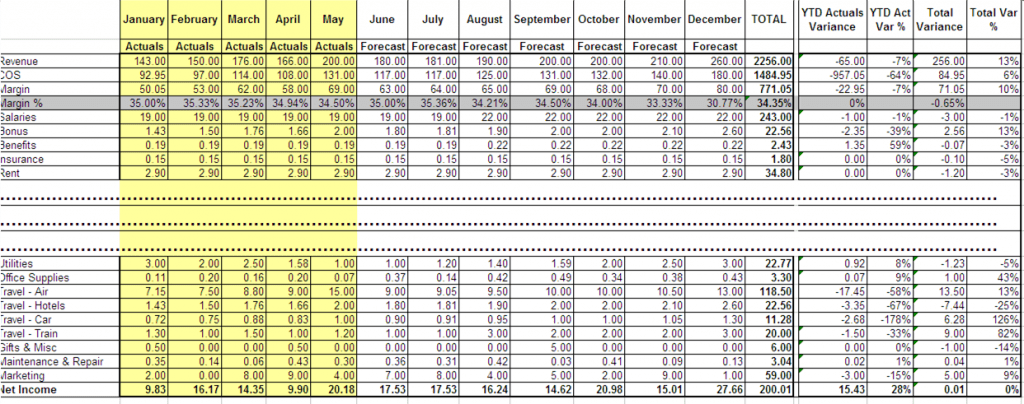
This is a wasted opportunity. People should use that occasion to gain insights about their business. Lack thereof is likely to result in forecasts and budgets that are not meaningful. Some of you might say: ‘Wait a second! Managers do obtain some reports.’ True. They get the classic variance report with a ton of detail. But working with this is time-consuming and it is extremely difficult to identify critical trends and to see the big picture.
BETTER FORECASTING WITH ANALYSIS
Using a Business Analytics platform like IBM Cognos 10, you can make is easier for managers to gain critical insights. Here are a few ideas that you might find useful. Let’s look at the example of a sales manager for a European division of a global company. This manager has to forecast revenue and associated expense.
1. GO VISUAL
First of all, toss those detailed variance reports. Line of Business managers will most likely not obtain any information from them. Human beings do much better processing visual information. You can find a lot of information about this topic on this blog. So, try to swap out those hundreds of data points with a few meaningful charts. Your teams will be thankful.
2. CONSIDER EXTERNAL DATA
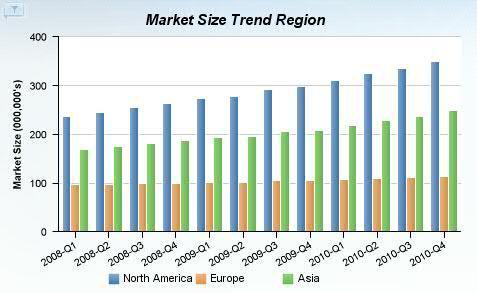
The variance report does not really tell us anything about our business potential. We could therefore consider looking at external data such as market trends. More and more of my clients do that. It helps them with assessing their overall position and it also helps them set realistic but ambitious targets. The example below shows that market growth in Europe is a bit limited compared to North America and Asia.
3. STUDY HISTORY
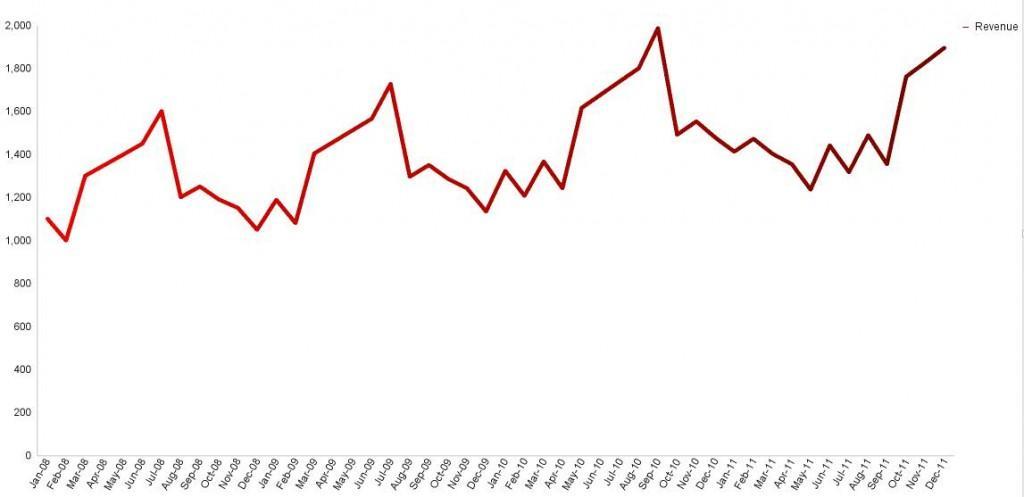
History is not necessarily a predictor of the future. But we should not ignore it. We might be able to identify seasonality and to detect general trends. Pick the critical measures. Line charts are usually a great choice to display this type of data. The example below shows that revenue is cyclical and that the general trend is positive:
4. CHANGE YOUR PERSPECTIVE
One of the nice things about modern Business Analytics tools like Cognos 10 is that we can view data from multiple different angles. Use that capability to your advantage! Try to explore different perspectives. Look at the example above. Now, compare this to the view below. Same data. Just a simple change in Cognos 10:

Our biggest months used to be in summer time. But that has shifted towards year-end. Same data – different perspective. Explore!
5. BENCHMARK YOURSELF
It makes sense to learn from others as well. We could do some internal benchmarking as well. In our example, we could look at deal sizes (looks like Europe’s deals are growing nicely and they are above company average):
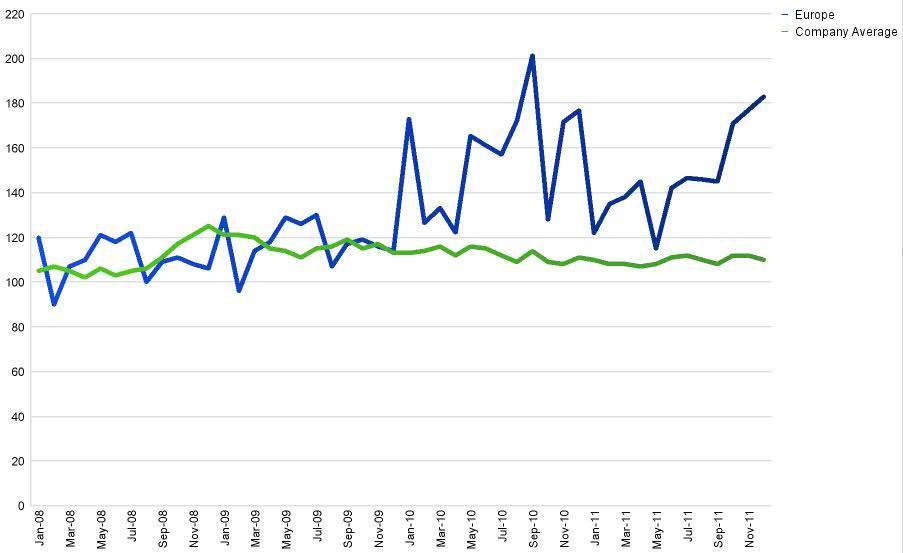
Ok. That sounds good. But does the deal size come at a cost? Once again, let’s do some internal benchmarking and look at the ratio of expenses and the associated revenue. It looks like Europe is slightly higher which might explain the higher deal size.
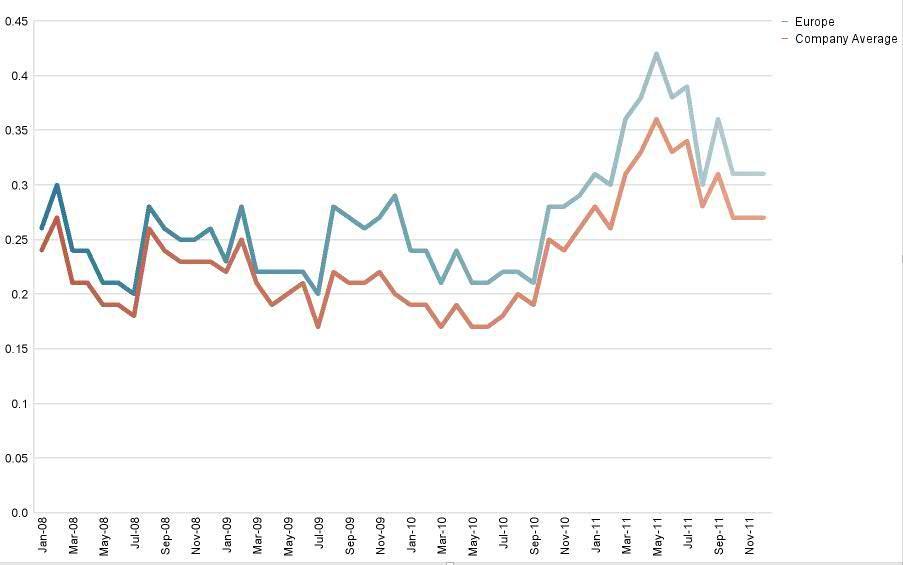
That information is valuable. It also leads us to think further and to ask some critical questions (Does it make sense to review our spending? Does the higher spending lead to bigger deals?). We should obviously not stop right here.
6. LOOK AT LEADING INDICATORS
What about other non-financial data as well? For revenue budgeting, I might also want to look at a leading indicator like customer satisfaction. And I might also want to look at our track record of winning deals (win-loss-ratio). Take a look:

BETTER INSIGHTS
This is a simple example. The manager is now equipped with a few key insights:
- Market growth is low
- Our revenue trend is still positive
- Buying patterns have shifted
- Our strategy of investing in selling activities has increased the deal size
- Customer satisfaction is increasing which could lead to higher sales
These are valuable insights. And it did not take much time to obtain them. The old variance report would not have provided that insight and it would have consumed a lot of time.
Try to incorporate a few of those ideas in your forecasting and budgeting processes. Doing this with spreadsheets is obviously difficult and probably explains why so many organizations are stuck with the traditional approach. Business Analytics software like IBM Cognos 10 makes it a lot easier to do that.

Comments
One response to “Better Forecasting And Budgeting Starts With Analysis – IBM Cognos 10 in Action”