
-

The Data Vault Experience Workshop
Data Vault Companies have long struggled with making their data warehouse resilient to change. While traditional data modeling approaches such as Kimball, Star schemas & Inmon are great for directly performing analytics, they have shown weaknesses when it comes to reacting to serious organizational changes. Retaining history properly and redesigning the schema can be challenging.…
-
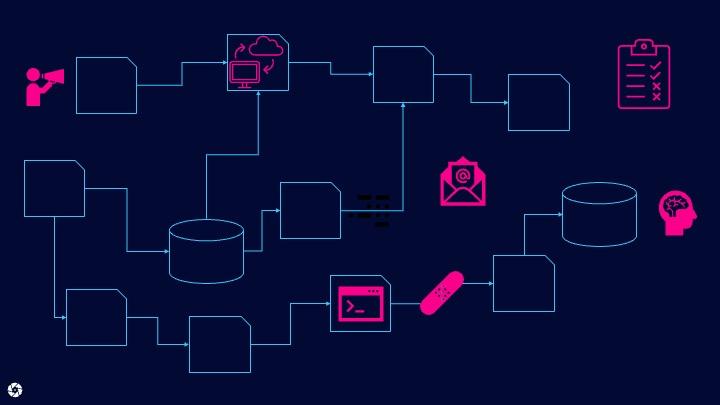
Is McGuyvering the right approach for your cloud data warehouse?
Developing & operating modern cloud data warehouses requires the right tools to handle the various complex associated tasks. Cutting corners by leveraging a concoction of disparate tools puts your investment at risk.
-
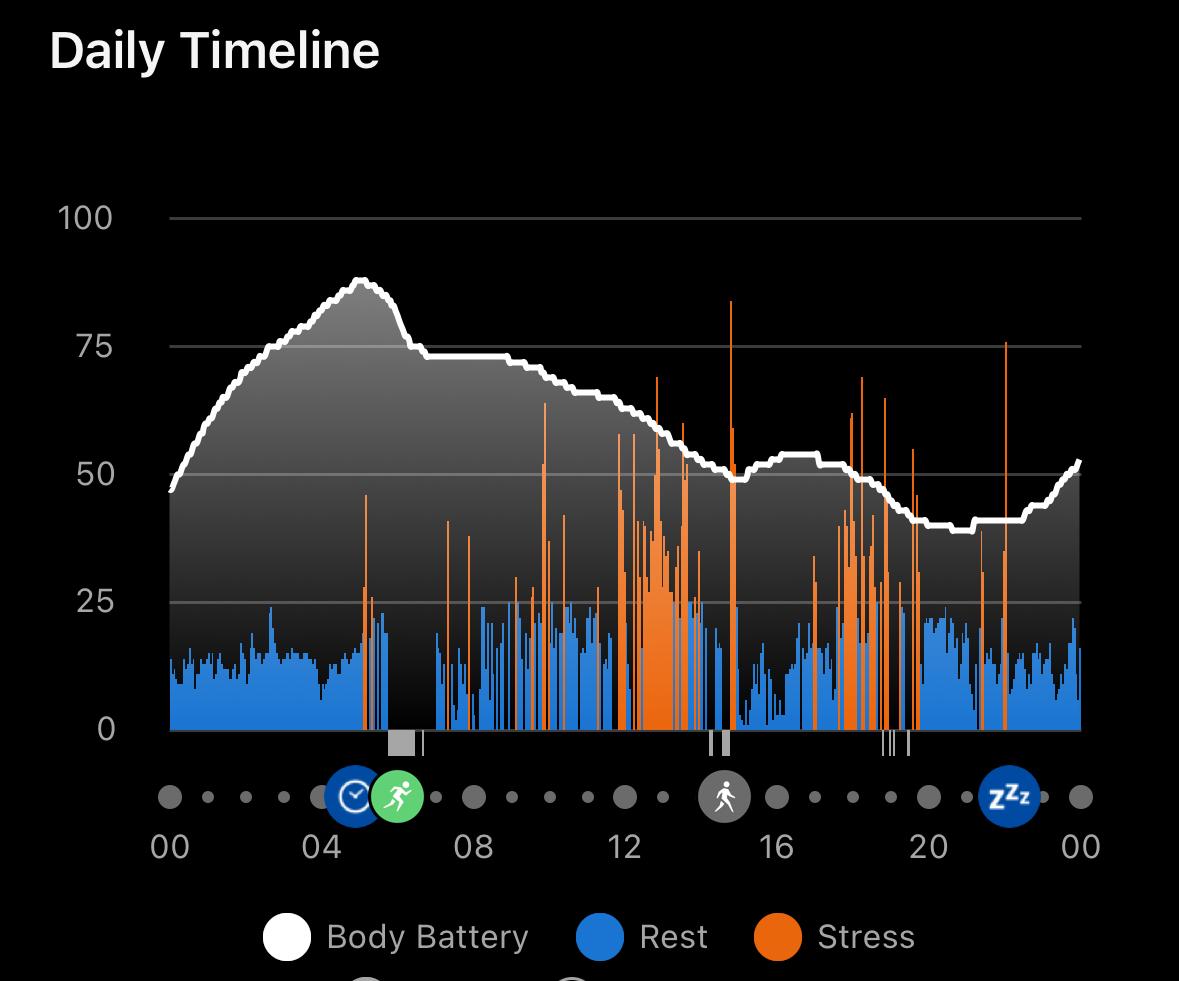
Ice Bathing Quantified
Shock! “OMG, OMG” – The discomfort I experienced was almost unbearable. My entire body was begging me to get out of the cold swimming pool on a dark & rainy afternoon in November of 2021. It was getting difficult to regulate my breathing. Two hotel guests walked by and shook their heads in disbelief that…
-
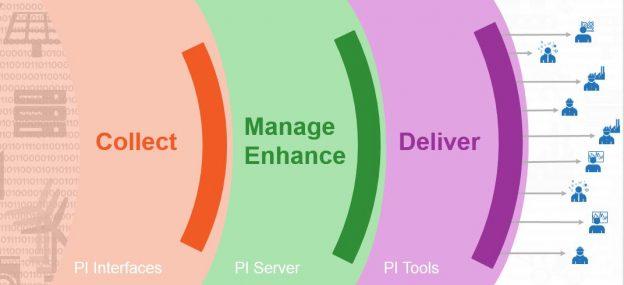
What is the OSIsoft PI System?
The OSIsoft PI System In the last two blog posts, I spoke about Industry 4.0 and the challenges around working with industrial sensor data. Let me attempt to quickyl summarize the outlined problems: Industry 4.0 initiatives require a ton of time-series data. Acquiring, managing and analyzing this can be extremely challenging. This is where the…
-
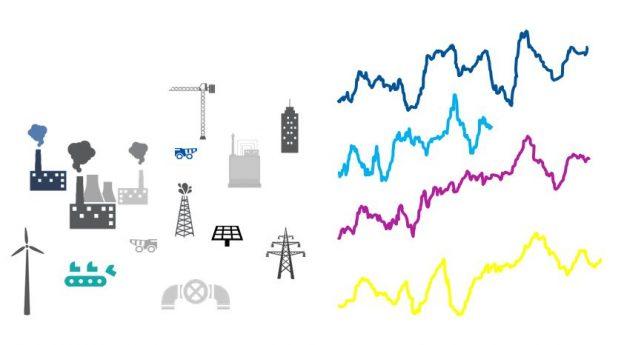
Industry 4.0 and the sensor data analytics problem
That sensor data problem A few weeks ago, I met with a number of IT consultants who had been hired to provide data science knowledge for an Industry 4.0 project at a large German industrial company. The day I saw them they looked frazzled and frustrated. At the beginning of our meeting they spoke about…
-
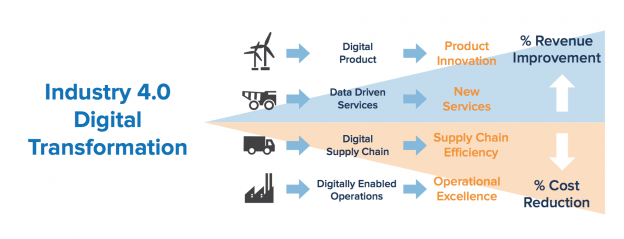
Industry 4.0 & Big Data
Industry 4.0 If you work in a manufacturing related industry, it’s difficult to escape the ideas and concepts of Industry 4.0. A brainchild of the German government, Industry 4.0 is a framework that is intended to revolutionize the manufacturing world. Similar to what the steam engine did for us earlier in the last century, smart usage…
-
Keep natural gas flowing with analytics
The Power of Data Last week, I had the honor to moderate the OSIsoft 2014 user conference in San Francisco. Over 2000 professionals came together to discuss the value and use of real-time data across different industries. There were a ton of really interesting and inspiring customer presentations. It’s just amazing to see how much…
-
The Power of Data
The Power of Data Real-time data is all around us. Modern sensors allow us to capture enormous amounts of data at extremely high frequencies. Here is an example: grid operators nowadays utilize so-called syncrophasors (also called PMUs) to record over 40 different KPIs at 120hz. They use this information to keep our electric supply safe…
-
Data is only useful if you use it!
The value factor We have all become data collectors. This is true for corporations and individuals. Organizations store petabytes worth of customer transactions, social sentiment and machine data. SAP’s Timo Elliott recently wrote a nice blog post about the ‘datafication’ of our own private lives. Just to give you a personal example, I have over…
Got any book recommendations?